Sun Valley, CA - June 27: Supporters cheer on LA City Council District 6 special election candidate Imelda Padilla, center, at her election party at Chicuagle in Sun Valley Tuesday, June 27, 2023. (Allen J. Schaben / Los Angeles Times via Getty Images)
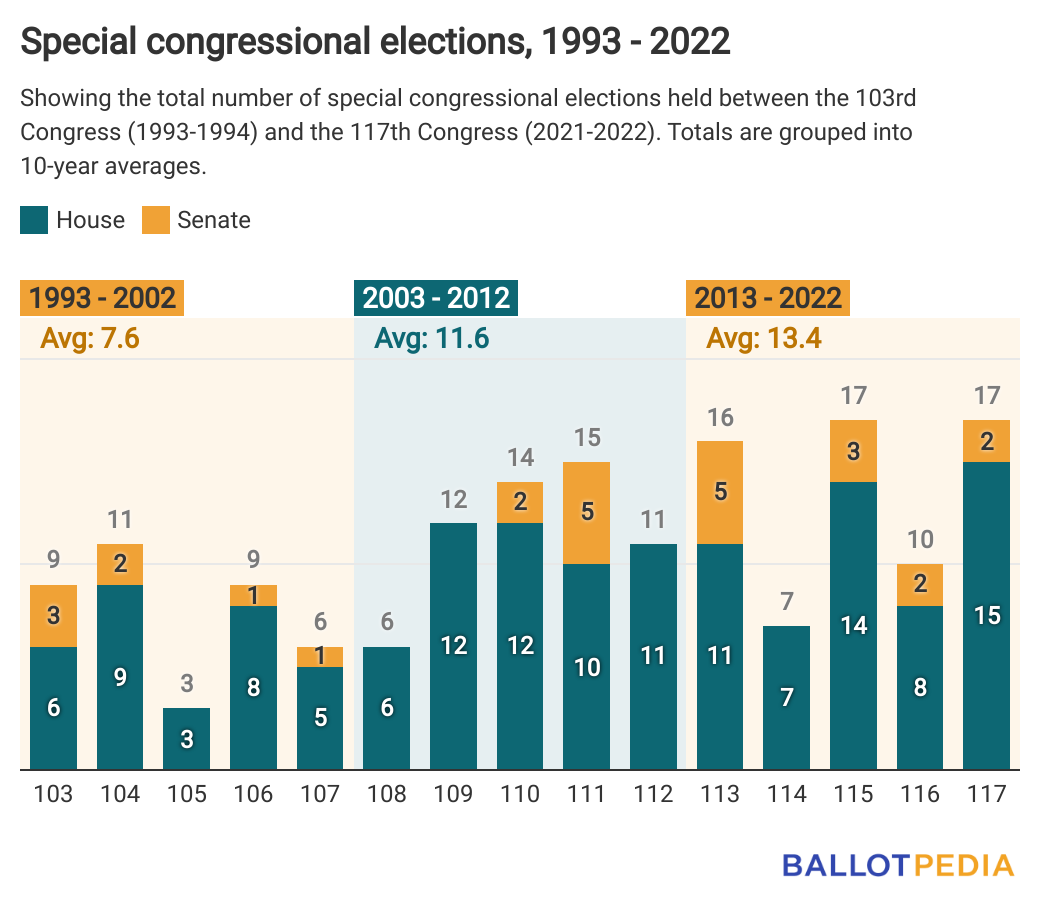
The number of special congressional elections has increased steadily over the past three decades, from an average of 7.6 special elections in the five meetings after redistricting in the 1990s to an average of 13.4 in the five meetings after redistricting in the 2010s.
Statistics of special elections that have occurred in both chambers of Congress over the years. Various factors have come into play for special elections. COURTESY/BALLOTPEDIA
The trend towards more special elections is true for both the U.S. House and Senate. The average number of House special elections increased from 6.2 in the 1990s to 11.0 in the 2010s. For the Senate, the average increased from 1.4 to 2.4 during that time.
A congressional special election takes place when an incumbent resigns, dies, or is removed from office. The Constitution requires that all vacancies in the U.S. House be filled through an election.
But states get to decide how to fill Senate vacancies, with only 13 requiring a special election. In the remaining 37, the governor makes an appointment to fill the vacancy temporarily. After that, the state holds an election at the next regularly-scheduled date to fill out the remainder of the term.
Live from D.C.'s alphabet soup, see the newest insanity. Sign up for our free newsletter.
The 118th Congress began in January of this year. Since then, one special election has already been held in Virginia, and two are upcoming in Rhode Island and Utah. There will also be an election in 2024 in Nebraska to fill out the remaining two years of former U.S. Sen. Ben Sasse’s (R) term. Gov. Jim Pillen (R) appointed Pete Ricketts (R) to fill that vacancy earlier this year.
Democrats and Republicans contested 51% of state legislative elections this year, down from 93% in 2021
Based on candidate filing deadline data available for 434 of the 578 state legislative seats up for election this year, 51% (220) will come down to a general election contest between Democrats and Republicans in November.
The remaining 49% (214)are effectively guaranteed to either Democrats (99) or Republicans (115) because they lack competition from the other major party.
This is a marked change from 2021, when 93% of elections had major party competition. But, as things stand, it does represent an increase from the 2019 election cycle, when only 44% of seats featured both a Democrat and a Republican.
These numbers will change. Candidates might drop out or be added to the ballot over the coming months. Plus, for 2023, we won’t have data from Louisiana until after its Aug. 10 filing deadline. Historically, the state has had a low rate of major party competition, ranging from 16% to 25% over the past decade.
ATLANTA, GEORGIA – NOVEMBER 29: Local resident Cierra Johnson (L) and her daughter Reniya Weekes (2nd L) hold signs to encourage people to vote early outside a polling station on November 29, 2022, in Atlanta, Georgia. Early voting has started in select Georgia counties for a special runoff election days after the Georgia Supreme Court rejected an emergency request from Republicans to block counties from offering early voting. (Alex Wong/Getty Images)
The fluctuations in the graphic above are due primarily to the calendar with off-year elections. While New Jersey and Virginia hold elections every two years, Louisiana and Mississippi hold them every four years, corresponding to 2011, 2015, 2019, and 2023 above.
Over the past decade, the percentage of seats contested with major party competition has decreased steadily in Mississippi and New Jersey, dropping 20 and 10 percentage points in both states, respectively, since 2011.
In Virginia, the rate has increased 30 percentage points during that same time, with a decade-high 91% of seats contested by both major parties in 2021.
In even-numbered years, the percentage of seats with major party competition has ranged from 56% (2014) to 65% (2010, 2020). Last year, 59% of state legislative seats had major party competition.
When comparing odd-year election cycles to their preceding even-year cycles, New Jersey routinely ranks as one of the most competitive states in terms of major party competition.
Comparing 2018 and 2019 percentages, New Jersey ranked fourth, Virginia ranked 34th, and Louisiana and Mississippi ranked 49th and 50th, respectively.
Comparing 2022 and 2023 percentages, again, New Jersey ranks fourth and Mississippi ranks last, with Virginia moving up to 18th.
In Ohio, the campaign behind a citizen-initiated constitutional amendment to create a Citizens Redistricting Commission submitted signatures on July 1, 2024.
Incumbent-free race attracts five front-runners; Franks, Hamadeh, Kern, Masters, and Toma lead in endorsements and support as primary approaches. Six candidates are running in the Republican primary in Arizona’s 8th Congressional District on July 30, 2024.